
The Overview
For the last stretch as a student in the ranks of academia, our team was tasked to work with a third-party organization dedicated to the discovery of new and better ways to build financial wellness for users with high income volatility. The development included a team of multi-disciplinary engineers ranging from both web and mobile developers, as well as data scientists. As we approached the starting line, some concerns were already making themselves clear- communication between the involved parties would have to be responsive, and having access to proper data.
As we made way nearing the end of the development cycle, some of our concerns solved themselves and we were able to receive data from the client. The mad dash for the finish line was underway, albeit moral was a little short, the team built most of the functions during this short span of time.
The Product Challenges
- Empower users to increase their savings and financial stability
- Take minimal time and effort to use
- Respond specifically to the needs and challenges of high income volatility and low-income users
The Product
Our team still decided to hit the ground running, the first few weeks of the development cycle included pre-production in the form of wireframe prototyping, and making sure we had an idea of the architecture, and tools we would require. This allowed us to not only align on what we would need, but we also had an idea about the workload involved. Some of these decisions were also taken from an interest to learn new packages, to expand our ability to adopt new tools and adapt.
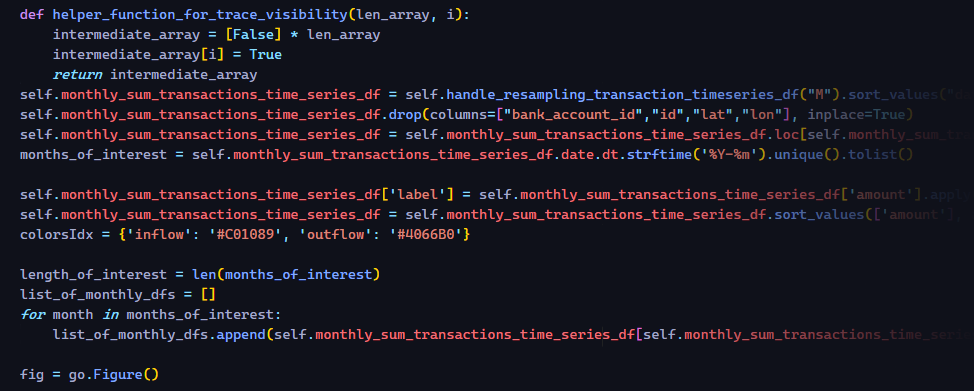
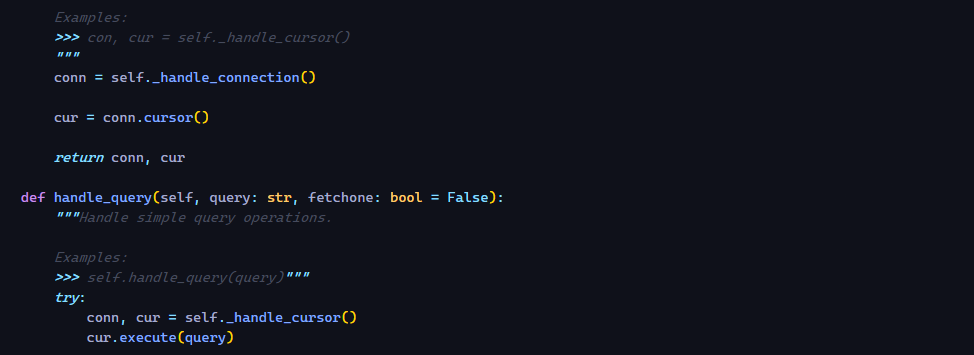
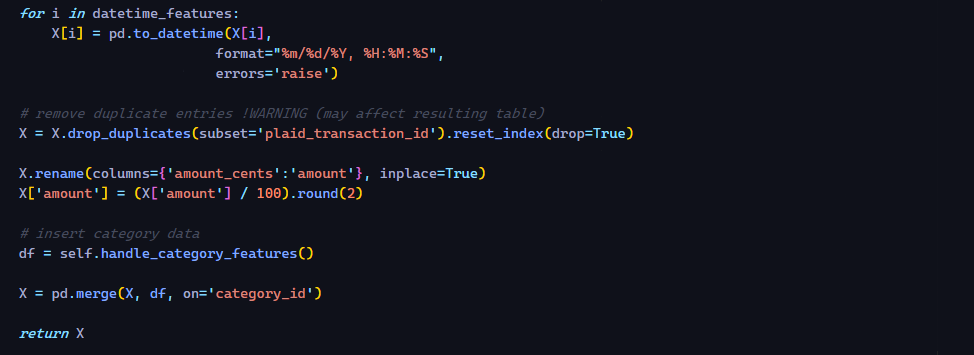
The Code
For the track of data science we decided to deploy our work using Amazon Web Services. This was not only efficient but intuitive! This handled most of the operational work required.
The Obstacles
Some of the challenges we faced revolved around two core issues- the lack of access to data other than a small sample, an amuse gueule of sorts, and friction within the curriculum of our program. The former casted doubt on whether to spend critical time to expand our components around the data we had, not knowing if the schema would change- usually a lot of work needs to be done if the data science tracks wants to develop a proper pipeline to bridge raw data sets, to other developers. Cleaning has to be streamlined to also accept new information, graphs have to be robust enough to not break with the introduction of new variables, if the underlying data changes somewhere along the lines, then the probability of having to rebuild entire components is definitely not slim.
The current state of the product includes a responsive application prototype. We have had a lot of ideas about what components or features we should implement. The team has never lacked interesting ideas, and sometimes we must bring ourselves back to the reality of the challenges we face, and the deliverables we must meet within a deadline.
With the deadline in mind, the data scientist opted for a naïve forecast that takes a user transaction history, and applies a general saving rate to future transactions in hopes of staying aligned with his own personal saving goals. Along with some visual tools, the user can see this information in either graphs or tables.
The Unknown
In conclusion, the future sure holds its secret close, some core curriculum changes are made without much notice and often times the content of the course is different for both the cohort ahead, and the one behind- it is my opinion that this concept alone accounts for most of the flaws or problems we encountered, which is the lack of a solid ground to stamp your feet on. This, along with a slew of other smaller problems made the experience and interesting ride. Looking back it’s obvious that most of the issues could’ve been worked around, or even pivoted to our advantage. We tried to make the best out of the experience, met great developers along the way, and have some work that we are happy to show.